
Nearly a Third of Colorado Imports Come From Canada
A High-Level Analysis of Colorado Import Trends as it Relates to U.S. Tariffs

After a number of delays and periods of uncertainty over the past several weeks, the U.S. will start imposing tariffs on imports from Canada and Mexico beginning March 4th (along with additional tariffs on Chinese imports). While I am certainly not an expert on international trade, I thought it would be useful to dig into data from the U.S. Census Bureau and highlight import statistics and characteristics for Colorado and the nation.
In 2024, the total value of goods imported into Colorado was $16.8 billion. Compared to all other states, $16.8 billion ranked 32nd nationally and represented 0.5% of U.S. imports, which totaled to over $3.2 trillion last year.

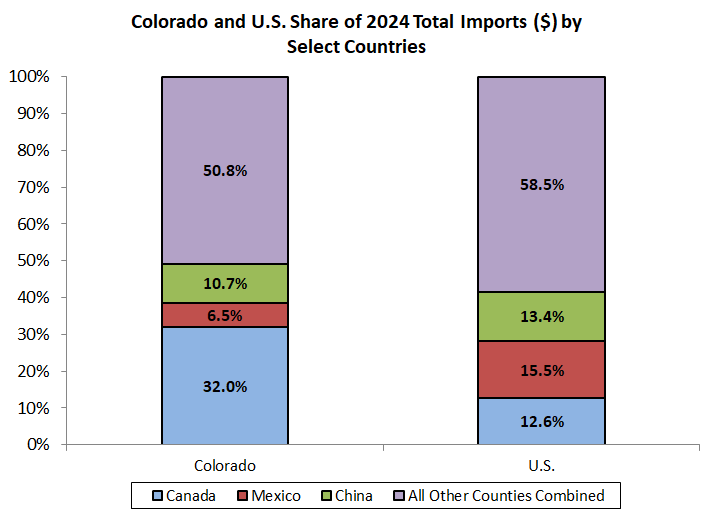
By far, Colorado’s largest trade partner for imports in 2024 was Canada, as 32% of the total value of imported goods (or $5.4 billion) came from our neighbors to the north. China (10.7%, or $1.8 billion) and Mexico (6.5%, or $1.1 billion) were the next largest drivers of Colorado imports. Combined, those three countries make up nearly half of the state’s total import value (49.2%). The top three import trade partners are the same for the U.S., although the order and share sizes differ (#1 Mexico: 15.5%, #2 China: 13.4%, #3 Canada: 12.6%).
Measured against other states, Colorado’s 49.2% share of total imported value that originated in Canada, Mexico, or China was the 17th largest distribution last year. Montana had the greatest share at 94.6%, with nearly that entire figure dominated by Canadian imports. Vermont, Michigan, North Dakota, and Maine rounded out the top five in that category. The table below shows each state that ranked top ten nationally in 2024 for share of total imports for that state stemming from Canada, Mexico, or China. This can be interpreted as a list of states that rely relatively heavily on imports from at least one of the three countries subject to tariffs starting today.

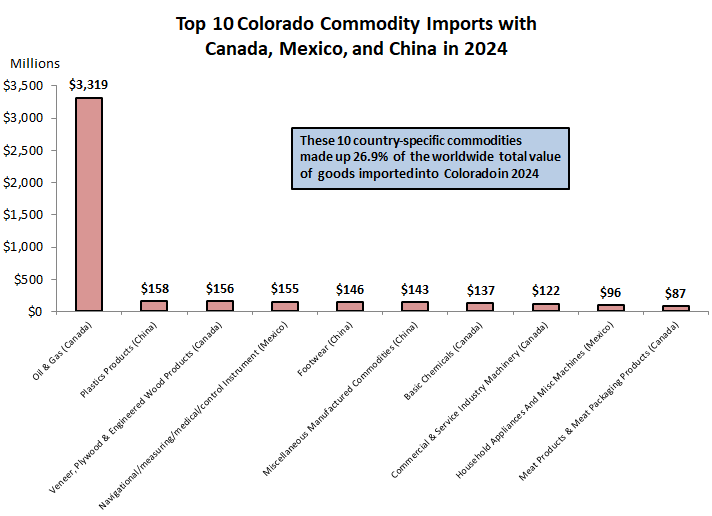
Imports can be broken out by type of commodity, or detailed industry. For Colorado, the overwhelming Canadian import is in the oil and gas category. In 2024, oil and gas imported from Canada to Colorado totaled $3.3 billion. That amount accounted for a staggering 62% of import value into Colorado from Canada last year and nearly one-fifth of all imports for the state. Colorado has one of the largest shares of total imports concentrated within Canadian oil and gas in the nation (following table). All other import commodities have less than a 3% share for Canada-to-Colorado trade.

There’s a more equitable distribution when looking at imports between Mexico and Colorado – 11 commodities have total value shares of at least 3%, all of which fall under some kind of manufacturing definition. Navigational, measuring, medical, and control instrument (14.2%), household appliances and miscellaneous machines (8.8%), and motor vehicles (6.7%) are the leading commodities with Mexico-to-Colorado trade. Similar to Mexico, there are 10 commodities that have total import value shares of at least 3% between Colorado and China. Plastics products (8.8%), footwear (8.1%), and miscellaneous manufactured commodities (8.0%) are the top commodities with regards to China-to-Colorado trade. Presented below are a table and chart that further illustrate some of the top import commodity activity between Colorado, Canada, Mexico, and China.

Given the oversized share of Canadian oil and gas imports to Colorado, any impacts to local prices at the pumps will certainly be worth following. Additionally, reciprocal tariffs from these countries on U.S. exports are likely to go into effect. Once those details become clearer, I’ll likely follow up on an article highlighting Colorado exports, so be on lookout for that future analysis.