


Goods Exported From Colorado to Mexico and Canada Totaled $3.3 Billion Last Year
A High-Level Analysis of Colorado Export Trends as it Relates to U.S. Tariffs

Over the weekend I took a trip up to Boulder with the primary goal of touring the Celestial Seasonings factory (or maybe secondary if we also consider the gift shop). As I was I thinking back to the heavenly scents of the Peppermint Room just five minutes prior, our tour guide mentioned that over 50% of Celestial Seasonings’ international exports go to Canada. Having just written an article on imports and vaguely promising a future analysis that would highlight Colorado exports, I interpreted this statistic as a not-too-subtle sign.
While there continues to be massive amounts of uncertainty regarding tariff activity with U.S. trade partners going forward, the topic will undoubtedly overshadow economic news, business attention, and consumer concern in this and following years. So similar to my prior import analysis, I think it will be beneficial to once again explore data from the U.S. Census Bureau and highlight export statistics and characteristics for Colorado and the nation.
In 2024, the total value of goods exported from Colorado was $10.5 billion, or $6.3 billion less than the state’s import sum last year. Compared to all other states, $10.5 billion in goods exported ranked 34th nationally and represented 0.5% of the U.S. total, which was around $2 trillion.
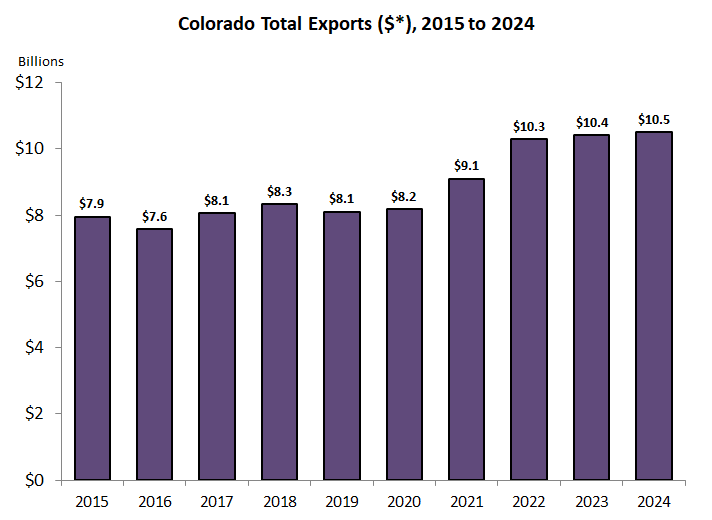
However, when taken as a share of Gross Domestic Product (GDP), Colorado’s total value of exported goods lags nearly every state. For instance, in 2023 Colorado exported goods equaled $10.4 billion in value, compared to a total GDP for the state of $529.6 billion (most recent data available). That translates to a ratio of 2.0%, which trails only D.C. and Hawaii. Comparatively, Louisiana, Kentucky, and Texas have the highest shares. The table below breaks out the top and bottom 10 states (including D.C.).

While Canada is the top country for Colorado imports, Mexico leads on exports from Colorado. Approximately $1.7 billion in exported Colorado goods went to Mexico in 2024, or 16.5% of the state’s total. Canada slightly trailed Mexico, with an export value and share at $1.6 billion and 15.7%, respectively. China rounded out the top three countries for Colorado exports last year, representing a little over $750 million in goods value. Combined, those three countries made up 39.4% of the state’s total export value, similar to the U.S. share of 40.1%.
The following chart displays the 10 countries that received the most exports from Colorado in 2024 (blue bar), along with comparative shares for the U.S. with those respective countries (red bar). Interestingly, South Korea, Malaysia, and Switzerland, the grouping of countries that constitute the next largest shares of Colorado exports (16.3% combined), are not as active of trade partners with the U.S. (5.7% in combined export value in 2024). Japan, Netherlands, Taiwan, and Germany comprised the rest of Colorado’s top 10 export destinations. For reference, the 10 countries that led the value of U.S. goods exported in 2024 are as follows: Canada (16.9%); Mexico (16.2%); China (7.0%); Netherlands (4.3%); United Kingdom (3.9%); Japan (3.9%); Germany (3.7%); South Korea (3.2%); Brazil (2.4%); and Singapore (2.2%).

Like with imports, exports can also be broken out by type of commodity, or industry. For Colorado, regardless of country of destination, the top export commodities fall under the broad food and kindred products industry definition, which represented nearly $2.3 billion in outgoing goods last year (at a detailed level, the bulk of that figure is driven by meat products and meat packing products, with over $2 billion in exports). Computer and electronic products was the other broad commodity that exceeded $2 billion in Colorado worldwide exports in 2024. Below presents the most sizeable broadly-defined commodities for Colorado exports last year. Combined, these six commodity groups made up nearly three-fourths of the state’s total export value in 2024.

The final portion of this analysis looks at detailed Colorado commodities that are most dependent on exports to either Canada or Mexico, along with those that have a relatively low reliance on the aforementioned countries.
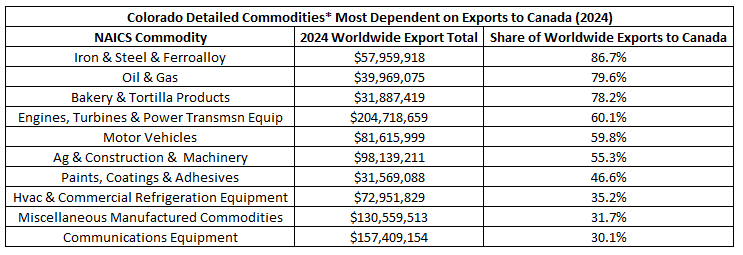
First is a table that displays Colorado detailed commodities with the highest shares of worldwide exports going to Canada (limited to those with at least $30 million in total exported value last year). Of the $58 million in iron, steel, and ferroalloy commodities Colorado exported in 2024, 86.7% of that total went to Canada. Additionally, nearly 80% of the state’s $40 million in oil and gas exports were destined for Canada, while the share for bakery and tortilla products was 78.2%. The remaining commodities shown have Colorado-to-Canada export ratios ranging between 30% and 60%.
The next table takes the same approach as above, but instead highlights Colorado exports to Mexico. Commodities within the boilers, tanks, and shipping containers group have the highest share at 86%, followed by rubber products at approximately 73%. The remaining commodities shown have Colorado-to-Mexico export ratios ranging between 20% and 41%. Within that list is meat products and meat packing products, Colorado’s only detailed commodity to surpass $2 billion in worldwide exports last year – 28.7% of that total was imported by Mexico. Notably, oil and gas is the sole commodity to show up on both the Canada and Mexico tables, as 100% of those Colorado exports are sent to the those two countries.

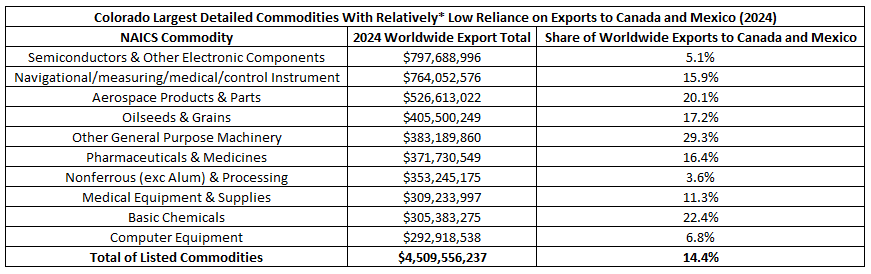
Finally, it’s helpful to assess the largest (by worldwide export value) detailed Colorado commodities with a relatively low reliance on exports to Canada and Mexico in 2024. The commodities in the table below all have shares of worldwide exports to Canada and Mexico of less than 32.2% (which is the Colorado ratio for all exported goods). These 10 commodities combined to represent $4.5 billion of Colorado’s 2024 exports, with less than 15% of that aggregated total being imported by Canada and Mexico. Nearly 95% of semiconductors and other electronic components goods (the second largest detailed commodity behind meat products and meat packing products), were exported from Colorado to countries not named Canada or Mexico.
As proposed or implemented tariffs continue to reverberate through the national and global economy, it will be crucial to track their potential impacts and untangle the barrage of seemingly daily information. Thanks to Joey Politano, I recently came across an extremely valuable resource from the Tax Foundation. For those interested, I highly recommend checking it out.