Exploring the Drivers of Colorado Wage Growth Since 2015
The final analysis in a five-part series covering various Colorado statistics produced by the Occupational Employment and Wage Statistics program
Click on the links below to view the first four parts in this series!
Part I: Overview | Part II: Metropolitan Statistical Areas | Part III: Location Quotients | Part IV: STEM
While datasets from the Occupational Employment and Wage Statistics (OEWS) can be a valuable resource for occupational statistics, one long-term limitation was the ability to adequately compare wage and employment estimates on a year-to-year basis. This constraint was driven by the sample design required to produce annual OEWS estimates, which relies on six panels of survey data collected over a three-year period (for example, 2023 OEWS estimates utilize information from survey panels conducted in November 2020, May 2021, November 2021, May 2022, November 2022, and May 2023). In order to address the methodological issue of year-to-year comparisons, the Bureau of Labor Statistics (BLS) embarked on research efforts near the end of the prior decade. What resulted was a new estimation method, known as MB3, which officially went into effect beginning with the 2021 estimates. Additionally, the BLS went through the effort to provide alternate OEWS estimates for 2015 to 2020, which reflected the MB3 estimation method (the raw data for those past estimates, as well as technical documentation for the MB3 method can be viewed at: https://www.bls.gov/oes/oes-mb3-methods.htm). The analysis below utilizes the MB3 re-estimates for 2015 and 2019, as well as the recent 2023 estimates (which already contains the MB3 methodology), and highlights median annual wage trends at the major occupational group level for Colorado. The period from 2015 to 2019 represents the tail-end of a long U.S. economic expansion and subsequently tight labor market, while 2019 to 2023 spans the COVID recession and the rapid recovery and historically dynamic labor market that followed.
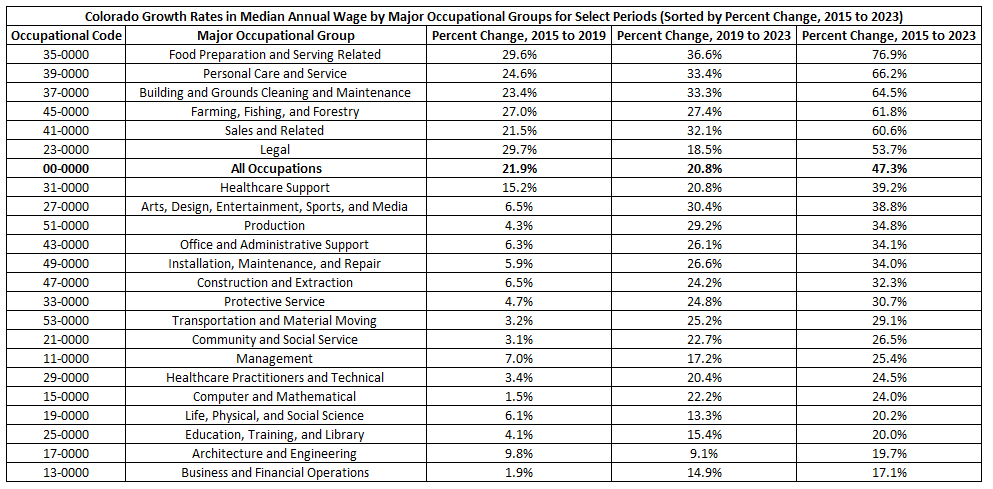
From 2015 to 2019, Colorado’s median annual wage for all occupations rose from $36,700 to $44,740, an increase of 21.9 percent. Comparatively, the change from 2019 to 2023 was similar, as the growth in the median annual wage was 20.8 percent, from $44,740 to $54,050. Over the eight years between 2015 and 2023, the gain of $17,350 in Colorado’s median annual wage represented a growth rate of 47.3 percent, which ranked 2nd nationally (interestingly, Colorado’s 21.9 percent growth rate between 2015 and 2019 ranked 3rd, while the 20.8 percent rate from 2019 to 2023 was outpaced by 32 other states).
Some notable trends emerge when analyzing median annual wage growth for Colorado’s 22 major occupational groups during the observed periods. From 2015 to 2019, the occupational group with the fastest increase in wages was legal occupations (29.7%), while the slowest growth occurred within the computer and mathematical group (1.5%). During the 2019 to 2023 period, food preparation and serving related occupations led median wage gains for all groups at 36.6 percent, and architecture and engineering occupations trailed with a rate of 9.1 percent. The five Colorado occupational groups with the largest changes in median wages from 2015 to 2023 were: food preparation and serving related ($20,160 to $35,670 – 76.9%); personal care and service ($22,570 to $47,520 – 66.2%); building and grounds cleaning and maintenance ($23,450 to $38,570 – 64.5%); farming, fishing, and forestry ($23,520 to $38,060 – 61.8%); and sales and related ($28,370 to $45,550 – 60.6%). One commonality between the five groups is that they all have relatively low median wages compared to the state total for all occupations.
Colorado’s median wage gain of 76.9 percent for food preparation and serving related occupations between 2015 and 2023 ranked as the 2nd fastest increase nationally (trailing Arizona’s 84.7 percent growth rate). In comparison, median wage gains for the U.S. over that same period were 58.9 percent, while Mississippi lagged all states with an increase of only 26.2 percent. Of note, food preparation and serving related occupations typically have the lowest earnings compared to other occupational groups, are more likely to be bound to the minimum wage, and tend to rely on heavily on tips (the BLS requires tips to be included when responding to the OEWS survey; however, it’s probable that underreporting is prevalent). According to the Economic Policy Institute’s minimum wage tracker, 30 states have increased their effective minimum wage since 2014. On average, those 30 states experienced slightly higher median wage growth in food preparation and serving related occupations between 2015 and 2023, in contrast to the 20 states with no change in their minimum wage (average gain of 57.9% compared to 52.5%).

Within Colorado’s food preparation and serving related occupations group, there’s a diverse range of changes in median wages during the highlighted periods. The two tables below present those trends for a select number of food preparation and serving related occupations.


