Curious About Which Jobs Pay Well or Employ the Most People? There's Data for That!
Part one in a five-part series covering various Colorado statistics produced by the Occupational Employment and Wage Statistics program

Earlier today, the Bureau of Labor Statistics published the 2023 annual estimates that are produced by the Occupational Employment and Wage Statistics (OEWS) program. These estimates are available for the nation, all 50 states (including D.C., Guam, Puerto Rico, and the Virgin Islands), and sub-state areas (Metropolitan Statistical Areas and Nonmetropolitan Areas). Information on employment and wages may be available for over 800 detailed occupations at these various geographic levels, making the OEWS datasets one of the most valuable resources for occupational statistics and trends.
For Colorado, occupational employment in 2023 totaled 2,832,010 (note: that total includes individuals who may be employed in multiple jobs or occupations at the same time). The five detailed occupations with the highest levels of employment were: fast food and counter workers (77,500; or 2.7% of the total); retail salespersons (75,200; 2.7%); stockers and order fillers (55,430; 2.0%); cashiers (55,270; 2.0%); and registered nurses (53,480; 1.9%). The 2023 median statewide hourly wage for registered nurses was $41.78 (or an annual equivalent of $86,900). The median hourly wage for the other four occupations listed ranged between $16.72 and $18.76. For comparison, the median statewide hourly wage for all occupations was $25.98 in 2023 (or an annual equivalent of $54,040).

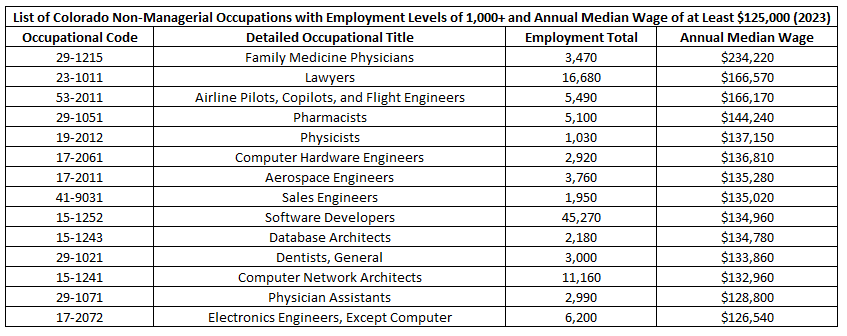
Out of the detailed Colorado occupations that do not fall under the broad management group and also had 2023 estimated employment levels that exceeded 1,000, fourteen had median annual wages that surpassed $125,000. This list includes a few healthcare occupations (family medicine physicians; dentists; pharmacists; and physician assistants), several highly technical positions (sales engineers; software developers; aerospace engineers; physicists; database architects; computer hardware engineers; computer network architects; electronics engineers), as well as lawyers and airline pilots.