


U.S. Unemployment Claims for Federal Workers Rose Substantially Last Week
Using unemployment insurance data to track recent federal government layoffs

Every week the US Department of Labor publishes new data on unemployment insurance (UI) claims filed within each state and the nation. The most recent batch of data released yesterday reflect initial claims filed for the week ending February 22, which encompasses the widely-reported reduction of federal jobs that have occurred throughout this month. An initial claim is filed by an individual to initiate the UI benefits process, but does not automatically guarantee payment. However, initial claims historically serve as a reasonable proxy for layoff activity. While the newest data captures activity through the 22nd, it presents an incomplete picture of this rapidly developing situation, which will only become clearer (from an analytical perspective) over time. That said, let’s look at some trends.
As the following chart shows, federal government (UCFE) initial unemployment claims rose substantially in the U.S. for the week spanning February 16 to February 22. 1,624 initial claims were filed nationally last week, compared to 614 the week prior. That increase of 164% is one of the largest week-over-week changes in federal government initial claims over the past 40 years.

While 1,600 national UCFE initial claims in a single week is historically not a rare occurrence, this marks the first time in three years in which that level has been surpassed. Looking back to the mid-1980s, there have been three notable and sizeable spikes in UCFE claim activity, all which coincided with government shutdowns. The first was in late 1995/early 1996; the second took place over 16 days in October 2013; and the third lasted over a month between December 2018 and January 2019. These three periods are the best benchmarks from which to compare current claims levels going forward.


Despite the national increase last week, Colorado UCFE initial claims remain low and unchanged. Over the past seven weeks, Colorado claims have not exceeded double digits and, at present, look fairly similar to last year.
Number of Colorado weekly UCFE initial claims filed in 2025:
January 4-11: 9
January 12-18: 3
January 19-25: 3
January 26-February 1: 5
February 2-8: 4
February 9-15: 3
February 16-22: 4
2025 Total So Far: 31
Across the U.S., seven states, and the District of Columbia, accounted for over 75% of the increase in UCFE claims for the week of February 22. Maryland, Georgia, and California all had weekly jumps of more than 100 UCFE claims and combined to make up nearly 47% of the national surge. D.C., Utah, Texas, Pennsylvania, and Massachusetts each experienced a gain of at least 30 UCFE claims last week. In total, 16 states (which includes D.C.) had UCFE initial claims grow by at least 10 on a week-over-week basis, which is something that has happened less than 11% of the time going back to 1986. That combination of factors is even rarer since the start of the new millennium, with an occurrence rate of 7.8% prior to last week.

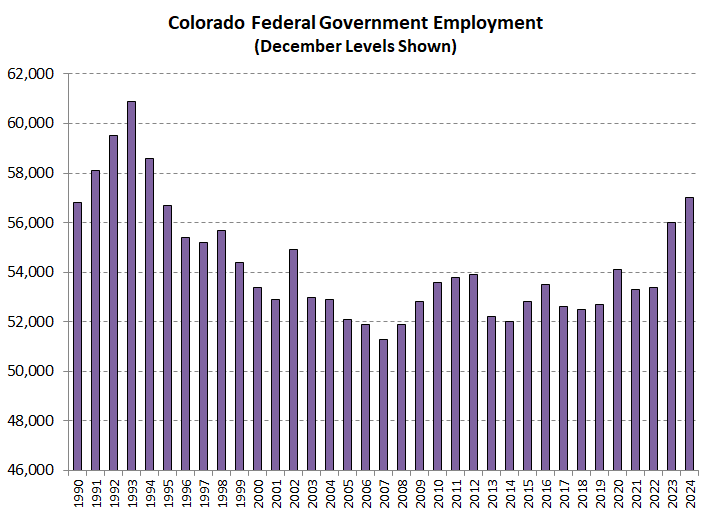
Finally, while there are a number of sources for estimating federal government employment, I’ll reference the most recent data available from the Current Employment Statistics program. In December 2024, Colorado had 57,000 federal employees, while the U.S. had just over 3 million (or around 2.4 million if the US Postal Service is excluded). Colorado federal employment has changed little over the past 35 years, with a low of 51,300 in 2007 and a high of 60,900 in 1993. The most recent estimate of 57,000 is nearly identical to the level in 1990. In comparison, private sector employment levels in Colorado have almost doubled over that same period (1.27 million to 2.53 million).
U.S. federal government employment, when measured as a share of total nonfarm employment, was at historically low levels in 2024. That share as hovered around 2% since the late 1990s (only temporarily increasing during the past two decennial Censuses), and has not been above 4% in over 50 years.

Based on annual Quarterly Census of Employment and Wages data from 2023, Colorado had the same concentration of federal employees as the U.S. (location quotient of 1.00), ranking below 20 states, D.C., Puerto Rico, and the Virgin Islands. California and Texas have the most federal government employees, followed by D.C., Virginia, and Maryland.
Stay tuned to this space for future updates on this topic.