Significant Improvement to Colorado’s Inflation Picture Last Year
Housing a key driver in a return to pre-pandemic annualized growth rates
What’s that, two articles in one day!? That’s right, here’s a quick bonus analysis for the long weekend.
On Wednesday the Bureau of Labor Statistics (BLS) released the December Consumer Price Index (CPI) estimates for the nation, which also meant that 2024 annual data was also available. While the BLS does not track inflation measures at the state level, statistics are produced for certain cities, including Denver-Aurora-Lakewood.
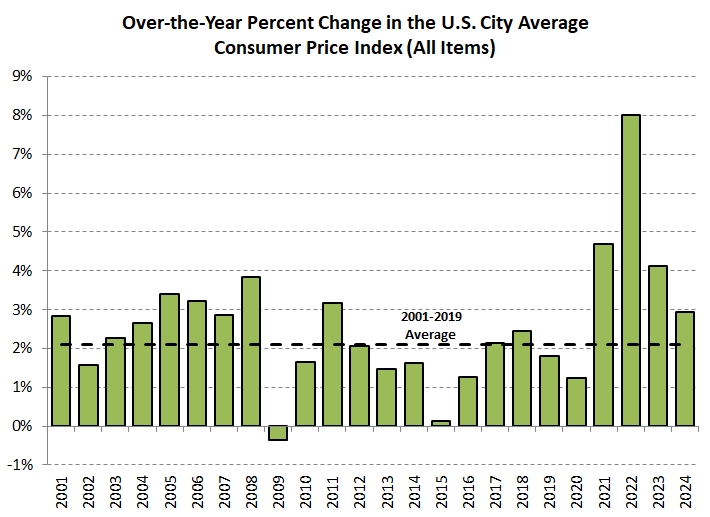
The U.S. CPI for all items increased at a rate of 2.9% in 2024, the lowest growth rate since 2020. While a welcome sight compared to the 40-year high of 8.0% in 2022, last year’s change in CPI remains stubbornly high relative to the pre-pandemic (2001-2019) average of 2.1%.
On the other hand, the Denver-Aurora-Lakewood metro area, which can be thought of as a proxy for Colorado, saw consumer prices rise by 2.3% last year, well below the U.S. and most of the other 20+ metros with published data. The 2024 growth rate for Denver-Aurora-Lakewood happens to match the 2001 to 2019 average, at least symbolically marking a return to pre-pandemic annual changes. 2024 also represented only the third time in the past 15 years when the Denver-Aurora-Lakewood CPI grew at a slower rate than the U.S. (2012 and 2021 the other instances).
While I won’t get too much into methodology, the BLS slots consumer prices into eight large categories, or components: apparel; education and communication; food and beverages; other goods and services; housing; medical care; recreation; and transportation. Each of these categories receives an updated weight each year; with those values being incorporated into the calculation of the broader CPI index (technical explanation from the BLS is available in this link). For the purposes of this article it is important to know that the housing component makes up nearly half of the allocated weights for the Denver-Aurora-Lakewood area, thus giving that category significant influence in determining the overall price index (here’s a useful article from Brookings that further explains the housing concept as it relates to CPI). Transportation and food and beverages combine to represent over a quarter of CPI weighting, while the remaining five categories make up the remaining share.
The following chart shows the respective 2023 and 2024 growth rates for seven components within Denver-Aurora-Lakewood (excluding apparel). Housing experienced tremendous improvement last year, with a growth rate of 2.9% compared to 7.8% in 2023. While the transportation index grew by only 2.2% in 2023, that rate slowed further in 2024 to 1.4%, thanks to lower energy costs (for reference, the 2021 and 2022 annual growth rates both exceeded 12%). The food and beverage index, which increased by 9.9% and 5.9% in 2022 and 2023, respectively, rose by 2.6% last year, the lowest growth for that category since 2019 (if you’d like to know more about food costs in Colorado, check out my previous analysis on that topic) . With those three components (housing, transportation, and food and beverages) representing over 75% of CPI weights, it’s easy to see how the aggregated index growth for all items in Denver-Aurora-Lakewood slowed substantially in 2024.

Finally, during the past five years, the over-the-year percent change in the Denver-Aurora-Lakewood housing component index has more or less moved with the U.S. However, there is a notable divergence in growth between the two areas over the second half of 2024. As presented below, Denver-Aurora-Lakewood has experienced a rapid slowdown in how much the housing index grew in the latter part of last year, while the U.S. rate exhibits a more gradual pace of disinflation. Given the importance of the housing component to overall CPI, it will be useful to continue watching these trends in 2025. January estimates for Denver-Aurora-Lakewood will be released on February 12.


