What is a Location Quotient and How Does That Identify Strengths and Weaknesses in Colorado?
Part three in a five-part series covering various Colorado statistics produced by the Occupational Employment and Wage Statistics program

One way of measuring an area’s relative concentration of occupational employment is through a metric known as a location quotient. According to the Bureau of Labor Statistics, “a location quotient is…the ratio of the share of an occupation’s local area employment to its share of U.S. employment.” A location quotient greater than 1.0 indicates a concentration higher than the U.S. for a particular occupation in a specific area, while a location quotient less than 1.0 indicates a lower concentration (although this concept can also be applied to industry statistics, this post will focus on occupational data). In other words, a location quotient can be a valuable source for assessing an area’s relative occupational strengths and weaknesses.
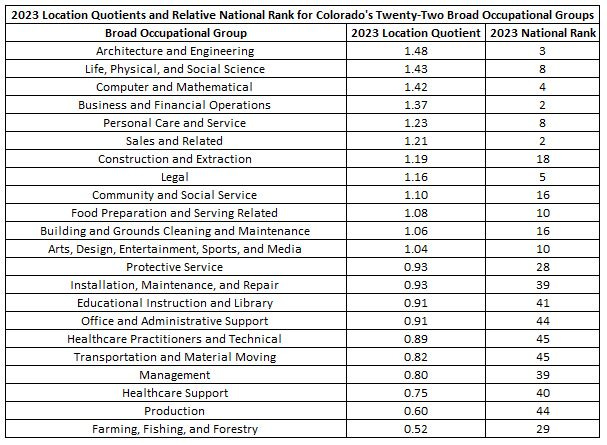
When looking at Colorado’s twenty-two broad occupational groups, there were six that had location quotients of 1.2 or greater in 2023: architecture and engineering (1.48); life, physical, and social science (1.43); computer and mathematical (1.42); business and financial operations (1.37); personal care and service (1.23); and sales and related (1.21). Only four broad occupational groups had location quotients that were 0.8 or lower in 2023: management (0.80); healthcare support (0.75); production (0.60); and farming, fishing, and forestry (0.52). Nine Colorado broad occupational groups respectively ranked top ten nationally (best ranking: 2nd, sales and related), while six occupational groups ranked in the bottom ten, compared to all other states (worst ranking: 45th, healthcare practitioners and technical; transportation and material moving)
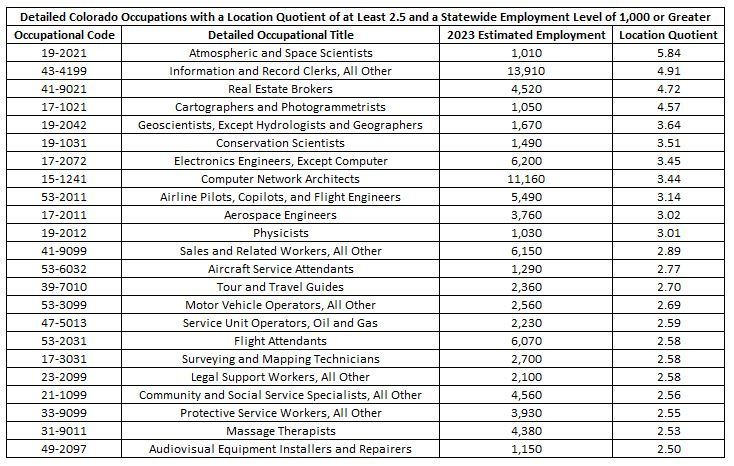
At a detailed occupational level, there were twenty-three Colorado occupations with location quotients of 2.5 or greater and that also had 2023 estimated statewide employment levels of at least 1,000. Atmospheric and space scientists had the highest location quotient within this group at 5.84, or a concentration nearly six times greater than the nation.
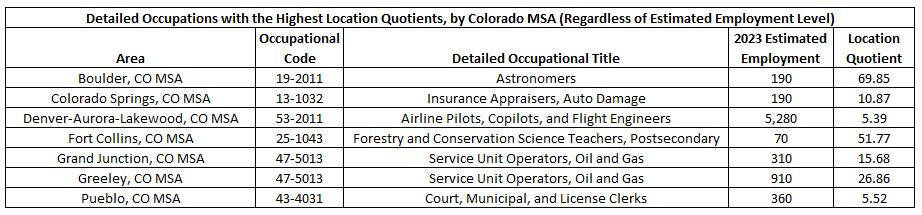
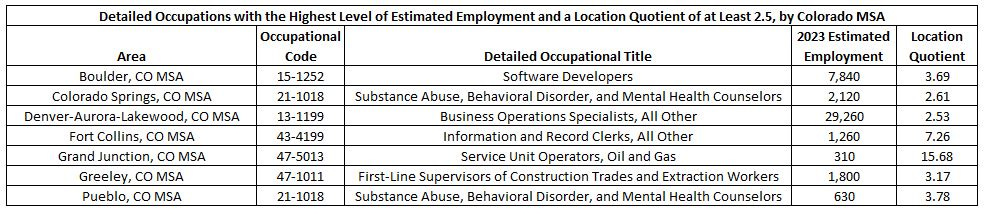
The tables below display a couple different approaches in evaluating detailed occupations with the highest location quotients for a given metropolitan statistical area (MSA). The first table shows the occupation with the highest location quotient for all seven Colorado MSAs, regardless of the 2023 estimated employment level for that specific occupation. The second table filters occupations in a Colorado MSA with a location quotient of at least 2.5 and highlights the occupation within that group that has the highest level of estimated employment.