How Should We Interpret Recent Colorado Employment Trends?
How Should We Interpret Recent Colorado Employment Trends?
An analysis of key Colorado employment statistics derived from the household and establishment surveys

At first glance, the most recent labor market statistics produced by the Colorado Department of Labor and Employment seem fairly positive. Colorado’s unemployment rate ticked up only one-tenth of a percentage point in May to 3.8% and remains below the U.S. rate, while nonfarm payrolls grew by 9,800 jobs, a relatively high monthly change compared to historical averages. However, closer analysis of key metrics reveals potentially worrisome trends for the state. This article will delve into Colorado employment statistics derived from the household and establishment surveys and highlight some primary concerns over the past year.
Household Survey Employment (aka total employment)
Simply, this employment measure estimates the number of individuals employed in Colorado during a given month (the self-employed are included). It is combined with the number of unemployed persons to create a count of how many Coloradans make up the state’s labor force. In May, Colorado’s total employment estimate was a little over 3.11 million, a decline of about 6,300 compared to the month prior, on a seasonally adjusted basis. Relative to a year ago, the state’s employment has fallen by 21,900, with 99% of that decrease taking place in the first five months of 2024. That reduction of 21,700 employed Coloradans between December 2023 and May 2024 translates to a growth rate of -0.69%, which ranks as the 4th worst percent change nationally. Additionally, there are only a handful of instances going back to 1976 when Colorado experienced a total employment decline of at least -0.69% over a five-month period: 1985-86 during the oil bust; 2008-10 spanning the Great Recession; 2020’s Pandemic Recession; and 2024.

The start of 2024 is in stark contrast to how the state has historically performed for total employment growth compared to other states. For instance, between 2012 and 2019 Colorado ranked 4th best, with a 19.5% increase in employment (trailing only Utah, Nevada, and Idaho). When considering employment growth from 2019 to 2023 (which included the pandemic and recovery that followed), Colorado’s employment growth rate of 3.5% was good enough to rank 12th nationally. Based on the table below, there are a few states that join Colorado for relatively strong pre-pandemic growth, but a weak beginning to 2024 (Utah and Washington, for example).

Coinciding with the decline in Colorado’s total employment is a rise in the state’s unemployment rate. Since December, the seasonally adjusted unemployment rate has moved up five-tenths of a percentage point, which is tied with two other states for the 3rd largest increase over that period.
Establishment Survey Employment (aka payroll jobs)
This employment metric looks at the number of payroll jobs in the state, excludes the self-employed, and contains many other definitional and sample size differences to the household survey employment estimates. The broadest scope of payroll jobs in Colorado, total nonfarm, rose to 2,991,100 in May, an all-time peak level for the state. On a seasonally adjusted basis, Colorado’s total nonfarm jobs have increased by 55,400 over the past 12 months (that converts to a percent change of 1.9%, which slightly exceeds the U.S. rate). In addition to state level figures, jobs estimates for Colorado’s seven Metropolitan Statistical Areas (MSAs) are generated. The table below shows the change in the number of total nonfarm payroll jobs from May 2023 to May 2024, on a seasonally adjusted basis, by MSA.

What likely stands out in that table is that Denver has experienced job loss of 8,200 over the past year and that the aggregated change for all seven MSAs sum to 11,400, or 21% of the state’s total increase of 55,400. Historically, the MSAs make up the vast majority of Colorado job gains when measured over a year. For example, between January 1992 and December 2000, the MSAs, on average, represented 86.1% of the number of Colorado jobs added over a 12-month period. Similarly, the MSA share of statewide jobs gained during the pre-pandemic expansion (2012 to 2019) rose to 92.9%. So for metropolitan areas in Colorado to account for less than a quarter of jobs added in the state since May 2023 is abnormal and noteworthy. An obvious driver to this disconnect is the Denver job loss mentioned above.
Denver’s job decline of 8,200 over the past 12 months translates to a decrease of 0.5%. That ranks as the 15th worst percent change in payroll jobs compared to 416 other MSAs with similarly available data. Relative to the 39 large MSAs spread throughout the U.S. (May 2024 payroll job levels of 1,000,000+), Denver’s recent rate of job change ranks last.

Denver industry-level job data is only available on a not seasonally adjusted basis (so not directly comparable to the figures above), but can help explain what is currently dragging down the metro area’s payroll estimates. Denver has lost 7,600 total nonfarm payroll jobs over the past year on an unadjusted basis. Government jobs have actually grown by 9,800 during that period, while private sector losses total 17,400. The private industry supersectors with the largest declines in jobs include: trade, transportation, and utilities (-7,500); leisure and hospitality (-6,800); and mining, logging, and construction (-4,400).
Divergence Between the Household and Establishment Survey Employment Estimates
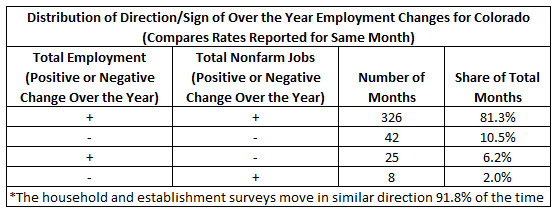
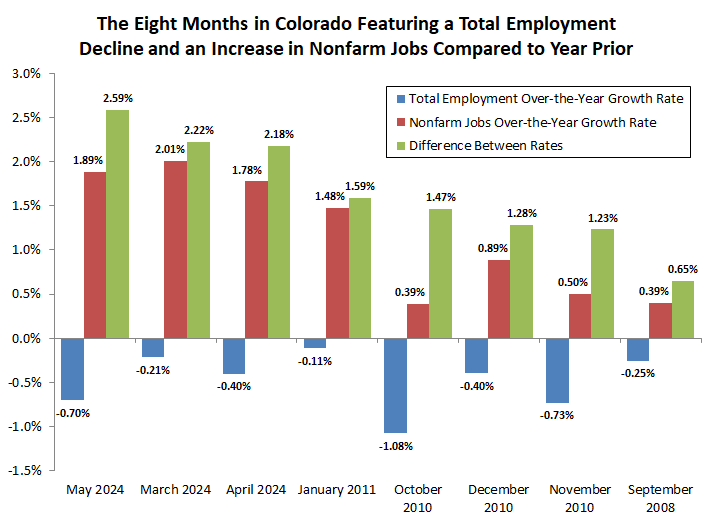
As previously discussed, both employment estimates come from separate surveys and measure different labor activity (number of persons employed vs. number of jobs). While the respective employment figures tend to move in a similar direction over a monthly or yearly basis, there are occasions when the estimates can diverge from each other, sometimes even drastically. The current estimates are an example of extreme separation between the two surveys (as a reminder, in May, total nonfarm jobs in Colorado grew by 55,400 when compared to the year prior, while total employment during that period contracted by 21,900). Going back to January 1991, there have been 50 months (or 12.5% of the time) where total employment in Colorado has decreased on an over-the-year basis, and 334 months (or 83.3% of the time) with a 12-month gain in nonfarm jobs. Notably, there have been only eight months over the past 33 years that feature both a decline in total employment and an increase in nonfarm jobs compared to the year prior: September 2008, October 2010-January 2011, and March-May 2024. However, out of those eight months, May 2024 has the largest difference between the two employment estimates when referencing growth rates (-0.70% for total employment and +1.89% for nonfarm jobs). The table and chart below display the information discussed above in more detail.